Regression
15pts
Python
Java
C++
Syntax
The fundamentals of regression in machine learning
To explain regression simply, it is a type of supervised learning
that involves making predictions on quantitative data (numbers).
Regression models can be used to calculate the relationship between
two variables or to predict new values.
Basic Regression
Let’s begin with an easier type of regression you are likely to
know, linear regression. With linear regression, the data is
preprocessed and labeled with the correct output. Linear regression
can be defined by the relationship y=wx+b where w are
the weights (slope) and b are the biases (y-intercept).
The goal of regression is to minimize the error of its predictions.
In this case, the error is the distance of the prediction from the
true value. The goal is to minimize the sum of the squares of the
errors ( (e1)2+(e2)2..., ex being the error of the
prediction of xth data point from the true value). Predictions
farther away from the actual value are significantly more noticeable
because the error is squared. This is also known as the Ordinary
Least Squares (OLS) Estimation.
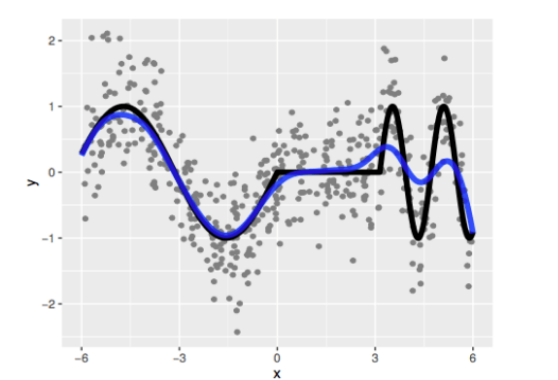
Linear regression is not always just a straight, linear line. The
weights and biases can change, leading to complex linear regression
models such as the one below.
When building a linear regression model, you must make the following
assumptions:
No Multicollinearity: Multicollinearity is the occurrence of
a high correlation between two or more independent variables in the
regression model. This reduces the significance of the correlation
between independent and dependent variables. We tend to assume there
is no multicollinearity between independent variables.
Homoscedasticity (same variance): Variance among all
independent variables should be similar as outliers could mess up
the linear regression model. This is important as the model can't
account for any unexplained variability in the dependent variables.
What happens if a linear model cannot fit your data? That’s where
non-linear models can help Common examples include logarithmic
regression and parametric regression.
Evaluating Performance
After building a basic regression model, you must have a way to
check its performance. Here are the common forms of evaluation of
linear regression data:
- R-squared: This represents the proportion of variance for a dependent variable explained by the independent variable, bigger |R| means higher correlation. This typically results in a value between 0 - 1. "0" means the independent variables do not represent the dependent variables at all and "1" means the opposite.
- Adjusted R-Squared: Modified R-squared depends on the number of predictors. It takes into account the addition of new predictors that may cause R-squared to rise.
- Root-mean-square-error (RMSE): This is calculated as the square root of the mean of the squared differences between actual outcomes and predictions, a lower error is better. This is used to measure the accuracy of models.
When building regression models, it is also important to consider
the bias and variance. Bias is the difference between predictions
and actual values. High bias indicates that a model is not specific
enough (overgeneralizing) and will not perform well with new data.
Variance is the spread of the data. High variance means the model
pays too much attention to training data and does not perform on new
data due to overfitting. When developing regression models, it is
important to establish a bias/variance tradeoff.
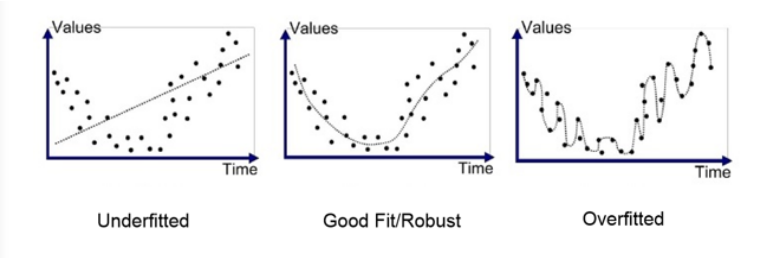
Overfitting and Underfitting
It is important to consider if a model is overfitting or
underfitting. This can be done by analyzing performance on the
training versus the test data set. Similar accuracies in the
training and test set indicate a well-trained model. Overfitting is
where a machine learning model cannot generalize well to an unknown
dataset, it fits its training data too well. Underfitting is when
the model is not fit well enough to produce accurate predictions on
training or testing data.
How can you address overfitting in a regression model? One option is
to remove unimportant variables from the dataset to reduce noise and
allow the model to generalize a bit more. Another method is to
perform regularization, where instead of removing variables, you
just reduce the importance of insignificant variables.
Regularization typically works better for larger datasets.
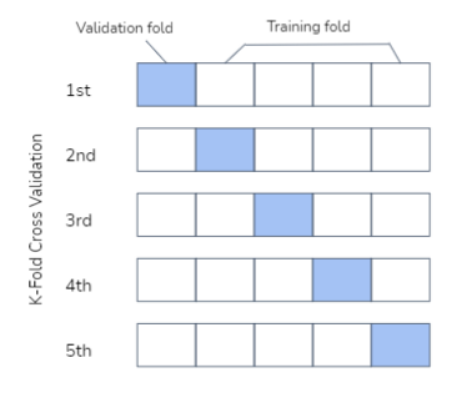
The analysis of training v.s. testing accuracy is called
cross-validation. In cross-validation, there is a type called K-fold
cross-validation. With K-fold cross-validation, you will randomly
divide data into n groups and use one of the groups as a validation
fold and the rest as the training fold, then repeat this process for
every group.
Forecasting
Forecasting is the application of regression models to time-series
data. Basically, you will use previously collected data to predict
future data points. Some real-world applications include predicting
trends in weather, pandemics, and the stock market.